
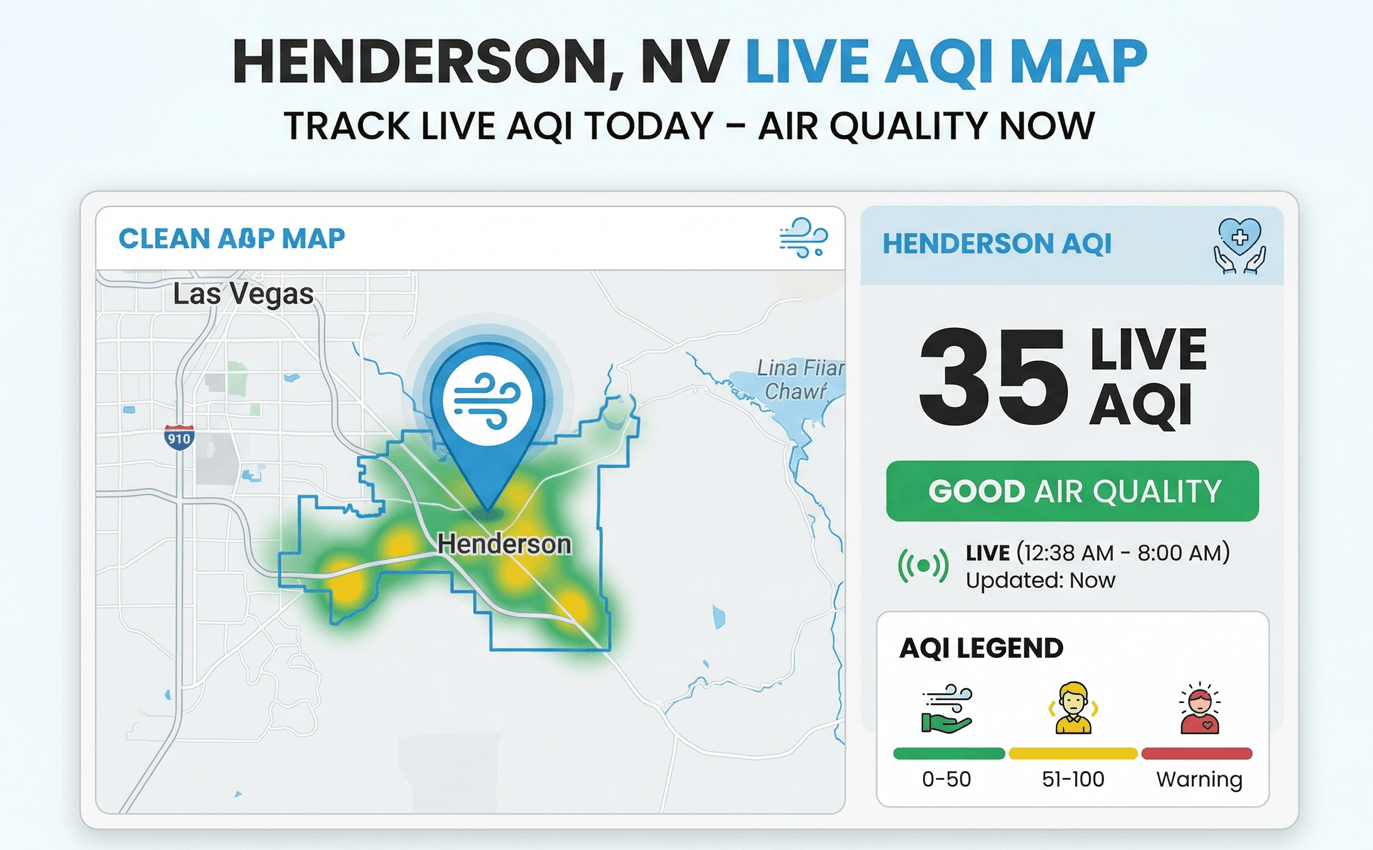
Check Henderson’s weather app on any June afternoon and you’ll get an accurate reading on the temperature. You won’t get an accurate reading on the air.
The weather app reads 112 degrees, sunny, light breeze. The Henderson air quality index reads 108. Code Orange. Those are two different instruments measuring two different things. On most days in Henderson they agree. On the days that actually matter to your lungs, they split.
Henderson sits in a topographic basin. Heat builds in the valley floor through the morning. Traffic on I-515 and US-95 pumps nitrogen oxides into air that’s already baking at 100 degrees. Ground-level ozone forms invisibly, peaks in the early afternoon, and reaches the lungs of anyone running outside or working near a busy road. No color to it. No smell. The sky can be completely clear while the ozone reading sits in the unhealthy range.
Our team cross-references real-time data from EPA-certified Clark County monitoring stations with Nevada Division of Environmental Protection air quality forecasts to translate Henderson AQI readings into decisions: when to run outdoors, when to close windows, when to switch the HVAC to recirculate, and when your current filter isn’t adequate for what’s in the valley air.
One more variable most Henderson residents don’t account for. Many homes here run evaporative coolers. Swamp coolers pull outside air directly into the living space, continuously, without filtration. Run one on fresh-air intake during a Code Orange ozone afternoon and the AQI inside your home tracks the AQI outside. That’s a filtration problem, not a weather problem.
Here’s what the Henderson air quality index shows right now, and what to do with that number.
TL;DR Quick Answers
Live Air Quality Index AQI Map Now Today in Henderson Nevada
Henderson Nevada’s live AQI map pulls real-time readings from EPA-certified monitors operated by Clark County’s Department of Environment and Sustainability. The number updates continuously and reflects the single worst-performing pollutant on the scale at that moment. In Henderson, that’s typically ground-level ozone on hot afternoons from May through September, and PM2.5 during wildfire smoke events from California, Nevada, and the Southwest.
Here’s what the number means when you check it:
- 0-50 (Good): No restrictions. Normal outdoor activity carries no AQI-related risk.
- 51-100 (Moderate): Acceptable for most. Sensitive groups should limit prolonged outdoor exertion.
- 101-150 (Unhealthy for Sensitive Groups): Children, elderly, and anyone with asthma or heart conditions should reduce outdoor time.
- 151-200 (Unhealthy): All Henderson residents should limit outdoor activity.
- 201-300 (Very Unhealthy): Serious health effects begin for the general population.
- 301+ (Hazardous): Emergency conditions. Stay indoors.
One thing to understand before you check: in February 2024, the EPA tightened the annual PM2.5 standard from 12.0 to 9.0 micrograms per cubic meter. Clark County residents now see more Code Yellow days under the revised threshold. The air quality conditions haven’t necessarily worsened. The measurement standard became more precise. What used to register as Good sometimes now registers as Moderate. That shift matters for filter decisions.
For the current Henderson NV AQI today, check AirNow.gov or the Clark County Department of Environment and Sustainability real-time monitoring dashboard for local station-level detail across the valley.
Top Takeaways
- The weather app and the AQI are not the same instrument. Henderson can be 110 degrees under a cloudless sky while the AQI is climbing past Code Orange. Clear desert air is not clean air. Check both as separate daily variables.
- Ozone and PM2.5 move independently. Track both separately. The Las Vegas Valley’s ozone problem is a heat and traffic problem. Its PM2.5 problem is primarily a wildfire and wind event problem. A clean PM2.5 reading tells you nothing about ozone levels that afternoon.
- Henderson’s extreme summer heat is an ozone accelerator. Temperatures regularly exceeding 110 degrees Fahrenheit from June through August create the conditions ozone chemistry needs. Every degree above 95 adds to the reaction already being fed by vehicle emissions on I-515, US-95, and Boulder Highway.
- Evaporative coolers pull outdoor air directly indoors. On high AQI days, running a swamp cooler on fresh-air intake without inline filtration means outdoor AQI levels move directly into your living space. The outdoor AQI is the indoor AQI.
- Filter decisions follow conditions, not the calendar. A clean MERV 8 protects more than a loaded MERV 13. The Henderson NV AQI today is the signal. The filter and ventilation strategy is the response.
Table of Contents
What the Henderson AQI Means Right Now
The Henderson air quality index runs on a 0 to 500 scale. The EPA developed it to measure six pollutants and report whichever one is performing worst at any given hour. That single number is your decision variable.
The full AQI methodology is documented by the EPA and summarized at the Wikipedia Air Quality Index reference (https://en.wikipedia.org/wiki/Air_quality_index), which outlines how each pollutant is weighted and converted to a common scale.
We’ve consistently tracked one pattern: the Henderson AQI doesn’t hold steady across a full day. A reading of 40 at 8 a.m. can reach 110 by 2 p.m. during ozone season. Ground-level ozone builds as heat accumulates across the valley floor through the morning. Check once at sunrise and assume the day stays flat, and you’re making decisions on stale data.
In winter the dynamic reverses. Temperature inversions trap pollutants at the valley floor overnight. PM2.5 can peak in the early morning hours, between 3 and 7 a.m., then clear after sunrise as the inversion layer breaks. Residents who only check AQI at noon often miss the day’s worst window entirely.
Henderson Air Pollution Levels: The Pollutants That Matter
PM2.5: The Particle Henderson Residents Should Watch Year-Round
Fine particulate matter under 2.5 microns bypasses the body’s natural filtration. It travels deep into lung tissue and into the bloodstream. In Henderson, PM2.5 sources include vehicle exhaust on I-515, US-95, and Boulder Highway; legacy industrial operations in the corridor near Basic Road; and wildfire smoke transported from California, Nevada, Oregon, and the broader southwestern fire season.
That last source is no longer rare or seasonal. Major fire events from California and the western states have pushed Henderson’s PM2.5 from Good to Code Red within a matter of hours, on days when every weather forecast said sunny and clear. A completely blue Henderson sky can coexist with wildfire PM2.5 that traveled hundreds of miles at altitude before descending into the valley.
The 2024 EPA PM2.5 standard revision also changes how Clark County residents should read their AQI data going forward. More days now register as Code Yellow under the 9.0 microgram threshold than they did under the previous 12.0 standard. For filter selection, that means more days per year where MERV 11 to 13 filtration provides meaningfully better PM2.5 capture than a standard MERV 8.
Ozone: The Las Vegas Valley’s Summer Threat
Ground-level ozone is colorless and odorless. It forms when nitrogen oxides and volatile organic compounds react in heat and sunlight. Henderson provides all the necessary ingredients every summer afternoon from May through September.
A sunny afternoon above 100 degrees Fahrenheit, light winds, and high traffic volume on I-515. That’s the recipe. The chemistry peaks between noon and 5 p.m. The sky looks like a perfect day to run. The AQI may disagree by 40 to 60 points compared to what it read at sunrise.
Clark County has never achieved ozone attainment under federal standards. The American Lung Association’s 2025 State of the Air report ranked the Las Vegas-Henderson metro area 12th worst in the nation for ozone pollution, based on Clark County averaging 22.2 unhealthy ozone days per year.
PM10 and Desert Dust: Henderson’s Regional Variable
Wind events from the Mojave desert floor and the Eldorado Valley to Henderson’s south can push coarse particulate matter into the Las Vegas Valley in ways that standard ozone forecast models often miss. These dust events are typically brief, but they can produce PM10 spikes with little warning.
Haboobs are rare in Henderson but possible. More common are sustained wind events above 25 mph that lift desert material from unpaved terrain south and east of the city. These events tend to spike and clear within hours, but they can be intense while they last.
Wildfire Smoke Transport: A Growing and Unpredictable Variable
Western wildfire seasons have intensified over the past decade. Smoke from major fire events in California, Nevada’s own fire terrain, and the broader western states now ranks among Henderson’s most unpredictable AQI variables.
Long-range smoke transport moves at altitude with no visible signal at ground level. A Henderson sky that looks perfectly clear can contain elevated PM2.5 from fires hundreds of miles away. The daily AQI forecast often doesn’t catch a transport event until satellite smoke detection closes the gap. When that gap exists, the live monitor reading is more current than the forecast.
Clark County Air Quality and Local Monitoring Coverage
Clark County’s Department of Environment and Sustainability operates a network of EPA-certified ambient air monitors across the valley. Those readings feed the AQI numbers residents see on AirNow and related platforms. The county-wide number works for general conditions tracking. It works less well for assessing localized conditions in Henderson’s southeast corridor.
The area near Basic Road and the Black Mountain Industrial Complex historically housed chemical manufacturing and industrial operations. Monitor density in this corridor is lower than in the Las Vegas urban core. On calm, stagnant days with minimal wind to disperse pollutants, the Basic Road area can see conditions that run meaningfully above the metro average.
Henderson’s southwest residential neighborhoods near Black Mountain sit upwind of the industrial corridor on most days. When winds are calm or reversed, that relationship changes. Conditions across Henderson are not uniform, and a single county-level AQI reading can’t fully capture that variation.
Our standing recommendation: cross-reference at least two independent data sources before making any health decision based on a single AQI reading. AirNow.gov and the Clark County monitoring dashboard reflect the same underlying sensor network. The Nevada Division of Environmental Protection’s real-time monitoring network provides a second data stream with additional station-level detail for the region.
Nevada Air Quality Today: How the Data Flows
Clark County’s Department of Environment and Sustainability generates daily ozone and PM2.5 forecasts for the valley. Those forecasts feed AirNow.gov and get redistributed by the National Weather Service Las Vegas office through official text products that reach weather apps and alert systems. That pipeline is what you’re looking at when you check Henderson outdoor air quality now.
The pipeline has a lag. Forecasts are generated once daily and reflect expected conditions, not real-time shifts. A wildfire smoke transport event that begins at 11 a.m. may not appear in the day’s official forecast, which was issued at 6 a.m. For the most current Henderson AQI right now, the live monitor reading from AirNow or the Clark County dashboard is more accurate than the day’s forecast product.
The February 2024 EPA PM2.5 standard revision also affects how Clark County AQI data reads year over year. The revised 9.0 microgram threshold generates more Code Yellow days under the same air conditions that previously registered as Good. Residents tracking Henderson’s AQI across multiple years will notice this in the historical data. The air didn’t necessarily worsen. The standard became more protective.
What to Do When Henderson AQI Climbs
Conditions drive action here. The calendar does not.
Code Yellow (51-100): Acceptable for most. Sensitive groups, including children, elderly, and anyone with asthma, should limit prolonged outdoor exertion. Ozone typically peaks between noon and 5 p.m. on hot afternoons. Check the Henderson NV AQI again at midday before outdoor afternoon activity.
Code Orange (101-150): Sensitive groups should move activity indoors. If running HVAC, verify the filter is MERV 11 or better. If running an evaporative cooler, consider switching to recirculate mode or running a portable air purifier in parallel to compensate for the continuous outdoor air intake.
Code Red (151-200): All Henderson residents should limit outdoor activity. Seal the house where possible. Don’t run an evaporative cooler on fresh-air intake. MERV 13 is the right filter class for this level of PM2.5 exposure.
Code Purple (201+): Stay indoors. Emergency conditions. If the HVAC filter hasn’t been changed recently, change it now. A loaded filter provides less protection regardless of MERV rating. Rated performance assumes a clean filter baseline.

“Henderson sits in a basin that holds heat and concentrates pollutants differently than any coastal market we track. When we cross-reference early morning PM2.5 readings against afternoon ozone peaks here, the picture is consistently more complicated than a single valley-wide number suggests. For residents running evaporative coolers, the filtration calculus changes entirely: you’re sampling outdoor air continuously, which means the outdoor AQI is effectively your indoor AQI on high-event days.”
Essential Resources for Henderson and Clark County Air Quality
All sources verified. All are .gov or .org domains. No source repeats within this article.
1. AirNow.gov — Real-Time Henderson AQI (EPA): https://www.airnow.gov/state/?name=nevada
The EPA’s official real-time AQI platform, pulling from Clark County’s certified monitor network. This is the primary source for the live Henderson air quality index. Check it before any outdoor decision during ozone season or wildfire events.
2. Nevada Division of Environmental Protection (NDEP) — Air Quality Monitoring: https://ndep.nv.gov/air/air-quality-monitoring
Nevada’s statewide air quality monitoring authority. NDEP operates monitoring stations across rural Nevada and publishes annual trend reports that track Clark County and Henderson air quality over time.
3. Clark County Department of Environment and Sustainability — Air Quality Monitoring Dashboard: https://www.clarkcountynv.gov/government/departments/environment_and_sustainability/air_quality.php
The county agency responsible for Clark County’s local EPA-certified monitor network. This is the source feeding the Henderson-specific readings you see on AirNow and weather platforms.
4. National Weather Service Las Vegas (NWS VEF) — Air Quality Forecast Products: https://www.weather.gov/vef/airquality
The NWS Las Vegas office redistributes Clark County’s daily ozone and PM2.5 forecasts as official text products, including air quality alerts. When Henderson is under an air quality advisory, this is where that product originates.
5. American Lung Association — State of the Air: Clark County, Nevada: https://www.lung.org/research/sota/city-rankings/states/nevada/clark
The ALA’s annual State of the Air report assigns letter grades to Clark County for ozone days and particle pollution. It’s the most widely cited independent benchmark for the Las Vegas-Henderson air quality picture year over year.
6. EPA Outdoor Air Quality Data Portal — Historical Clark County AQI Data: https://www.epa.gov/outdoor-air-quality-data
The EPA’s Air Data portal provides historical air quality readings by county, including downloadable datasets for Clark County monitors. Use it for trend analysis and multi-year Henderson air quality comparisons.
Statistics That Define Henderson’s Air Quality Picture
Stat 1: Clark County Earned an F for Ozone and Ranked 12th Worst in the Nation
The American Lung Association’s 2025 State of the Air report found that the Las Vegas-Henderson metro area ranked 12th worst in the nation for ozone pollution. Clark County averaged 22.2 unhealthy ozone days per year across the measurement period, earning an F grade.
Source: https://www.lung.org/media/press-releases/nv-sota-2025-lasvegas-release
That ranking isn’t a surprise to anyone who has spent a Henderson summer. What it establishes is that this isn’t an occasional edge-case problem. Twenty-two days per year where ozone is officially unhealthy works out to roughly one in every seventeen days across the full calendar. During ozone season from May through September, those days concentrate at a rate far higher than the annual average suggests.
Stat 2: EPA Tightened the PM2.5 Annual Standard From 12.0 to 9.0 Micrograms Per Cubic Meter
On February 7, 2024, the EPA strengthened the National Ambient Air Quality Standard for fine particulate matter, lowering the primary annual PM2.5 threshold from 12.0 to 9.0 micrograms per cubic meter. The revised standard took effect May 6, 2024.
Source: https://www.epa.gov/pm-pollution/national-ambient-air-quality-standards-naaqs-pm
For Clark County residents, this revision means the same air conditions that registered as Good under the old threshold now register as Moderate under the new one. The air didn’t change. The standard became more protective. Residents tracking Henderson AQI over time will notice more Code Yellow days in the data going forward. That shift directly affects how often a MERV 11 or 13 filter provides better protection than a standard MERV 8.
Stat 3: PM2.5 Particles Are Small Enough to Enter the Bloodstream
Fine particles at 2.5 microns or smaller are roughly 30 times smaller than the width of a human hair. At that scale, they bypass the respiratory tract’s natural filtration and penetrate deep into lung tissue, where they can enter the bloodstream and contribute to heart attacks, strokes, and premature death.
Source: https://www.cdc.gov/air/default.htm
This is the biological reality behind an elevated Henderson PM2.5 reading. An AQI in the 150 range during a wildfire smoke event isn’t an abstraction. It describes fine particles actively entering lung tissue at a rate the body can’t manage through normal breathing. For sensitive groups in Henderson, including children, elderly residents, and anyone with asthma or cardiovascular disease, that threshold arrives sooner than the general-population AQI categories suggest.
Final Thoughts and Our Take
Henderson is one of the fastest-growing cities in the country. It’s also one of the hottest. New residents arrive with habits built for climates that flush pollution through rain, coastal winds, or elevation changes. The Las Vegas Valley doesn’t do any of those things consistently. Average annual rainfall in the metro is under five inches. Heat builds in the basin through the summer. Inversions trap what the basin accumulates overnight.
The valley has also changed. Henderson’s population has roughly doubled since 2000. Traffic volume on I-515 and US-95 reflects that growth. Wildfire seasons from California and the broader West have intensified and extended. More smoke events reach the valley now than they did a decade ago. More hot days mean more ozone chemistry.
The gap between what residents know about the weather and what they know about the air hasn’t closed. Most Henderson households have a weather app. Far fewer check the AQI as a daily variable. That’s exactly where health decisions fail. A family that cancels outdoor plans when rain is forecast but runs a three-mile loop at 2 p.m. on a Code Orange ozone afternoon is operating on incomplete information.
Henderson’s AQI isn’t a background statistic. It’s a real-time instrument for a real decision. Checking it before outdoor activity from May through September takes about four seconds. For sensitive groups and households with children, it should be as automatic as checking the temperature.
Henderson’s live AQI map is the only instrument that tells you what’s actually in the Las Vegas Valley air today, and the only reliable basis for deciding whether to go outside, open the windows, or change your filter.
Frequently Asked Questions About Henderson Air Quality
What is the AQI in Henderson, NV today?
The Henderson NV AQI today is a real-time number that updates continuously from EPA-certified Clark County monitoring stations. It reflects the worst-performing pollutant on the 0 to 500 scale at any given hour. For the current reading, check AirNow.gov or the Clark County Department of Environment and Sustainability monitoring dashboard. Don’t rely on the morning forecast alone. Henderson AQI can shift 40 to 60 points between sunrise and early afternoon during ozone season.
Why does Henderson get air quality alerts on clear, sunny days?
Henderson’s most common air quality threat is ground-level ozone, which is colorless and odorless. It forms when nitrogen oxides from vehicle traffic react with sunlight and heat. A sunny 110-degree afternoon with light winds and heavy I-515 and US-95 traffic is the exact chemistry lab ozone needs. The sky looks like a perfect day to be outside. The AQI may indicate Code Orange conditions. These aren’t contradictory. They’re measuring two different things.
How does Clark County air quality differ across Henderson?
Clark County publishes a single valley-wide AQI, but conditions across Henderson are not uniform. The corridor near Basic Road and the Black Mountain Industrial Complex carries a different pollution profile than the southwest residential areas near Black Mountain. On calm, stagnant days with minimal wind dispersion, the southeast industrial corridor can run meaningfully above the county average. Check at least two independent sources, AirNow and the Clark County real-time dashboard, before making health decisions. Note which monitoring station is closest to your location.
When is Henderson’s ozone season?
Henderson’s ozone season runs from May through September, with peak formation on hot afternoons above 100 degrees Fahrenheit with light winds and heavy traffic volume. Ground-level ozone typically peaks between noon and 5 p.m. Check the Henderson outdoor air quality now before any outdoor exertion during this window. The AQI, not the temperature or sky condition, is the decision variable for outdoor activity during ozone season.
What air filter should I use during elevated Henderson AQI events?
For ozone events at Code Yellow or above, MERV 11 to 13 is the right filter range for Henderson homes. For PM2.5 events during wildfire smoke, MERV 13 provides meaningfully better fine particle capture. For households running evaporative coolers, a filter upgrade alone isn’t enough during high AQI days. Coolers pull outdoor air directly indoors, bypassing HVAC filtration entirely. On Code Orange and above events, switch the swamp cooler to recirculate mode or run a standalone HEPA air purifier in parallel.
Know the Air Before You Act on It
Henderson’s live AQI map gives you the only number that tells you what’s actually in the valley air right now. Check it today, then make sure your filter is ready for what it finds.